Market data
Best Markets to Start a Home Service Business in 2027
We ranked 620 U.S. counties on growth, new homes, competition, homeownership and income to find the best places to start a home service or contracting business.

TLDR
- We scored 620 U.S. counties with 100,000+ people on growth, new homes, competition, homeownership and income. Fort Bend County, Texas came out on top.
- Texas has eight of the top 25. Most of the rest are fast-growing suburbs in the Southeast, the Midwest and Arizona.
- A ranking is a starting point. Look up your own county on our Markets map before you sign a lease or hire a crew.
Where you start a home service business matters almost as much as how well you do the work. The same crew, the same prices and the same truck can have a very different first year one county over.
So we pulled the latest Census numbers for every U.S. county with at least 100,000 people, 620 in all, and ranked them for anyone starting or growing a home service or contracting business in 2027.
How we ranked them
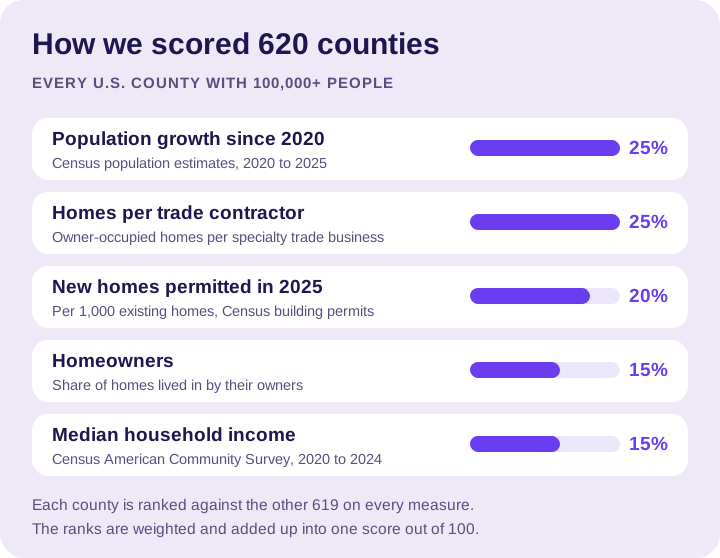
Five measures, all from the U.S. Census Bureau:
- Population growth since 2020. New residents need every service from scratch, and they don’t have a plumber yet. From the Population Estimates Program, April 2020 to July 2025.
- Homes per trade contractor. Owner-occupied homes for every specialty trade contractor in the county, from County Business Patterns. More homes per contractor means fewer competitors for each job.
- New homes permitted in 2025, per 1,000 existing homes, from the Building Permits Survey. New homes bring landscaping, fences and upgrades now, and first repairs a few years later.
- Homeowners: the share of homes lived in by their owners. Owners hire home services. Renters call the landlord.
- Median household income, from the American Community Survey, 2020 to 2024.
Each county is ranked against the others on every measure, then the ranks are weighted and added up.
One limit up front: County Business Patterns counts businesses with employees. One-person outfits aren’t in it, so every county has more competition than the count shows.
The top 25 counties for 2027
| Rank | County | Growth since 2020 | New homes per 1,000 (2025) | Homes per trade contractor | Homeowners | Median income |
|---|---|---|---|---|---|---|
| 1 | Fort Bend County, TX | +18.3% | 40.9 | 346 | 77% | $114,041 |
| 2 | Pinal County, AZ | +26.6% | 43.6 | 298 | 81.7% | $80,266 |
| 3 | Sumter County, FL | +21.6% | 41.8 | 474 | 87.6% | $76,508 |
| 4 | Lancaster County, SC | +19% | 25.3 | 301 | 83.3% | $78,869 |
| 5 | Delaware County, OH | +13% | 23.4 | 222 | 78.5% | $133,540 |
| 6 | Hamilton County, IN | +11.4% | 28.6 | 222 | 76.1% | $121,530 |
| 7 | Brazoria County, TX | +12.6% | 18.6 | 279 | 74.1% | $97,993 |
| 8 | Brunswick County, NC | +27.8% | 45 | 207 | 84.6% | $77,024 |
| 9 | Berkeley County, WV | +14.3% | 21.2 | 305 | 76% | $80,815 |
| 10 | Williamson County, TN | +9.8% | 16.7 | 217 | 78.8% | $135,594 |
| 11 | St. Johns County, FL | +26.7% | 35.5 | 169 | 82.2% | $109,839 |
| 12 | Liberty County, TX | +32.4% | 28 | 242 | 82.3% | $68,703 |
| 13 | Collin County, TX | +21.7% | 43.6 | 231 | 64.5% | $121,600 |
| 14 | Montgomery County, TX | +25.9% | 51.2 | 196 | 71.8% | $97,701 |
| 15 | Sandoval County, NM | +7.2% | 16.7 | 293 | 83.5% | $86,636 |
| 16 | Warren County, OH | +6.1% | 15 | 273 | 79.4% | $110,132 |
| 17 | Denton County, TX | +18% | 27.1 | 232 | 65.5% | $111,498 |
| 18 | Hendricks County, IN | +10.7% | 23.7 | 192 | 78.2% | $101,144 |
| 19 | Rockwall County, TX | +30.5% | 36.5 | 145 | 82.5% | $127,981 |
| 20 | Sussex County, DE | +16.8% | 25.6 | 194 | 81.6% | $81,497 |
| 21 | Moore County, NC | +10.9% | 21.4 | 216 | 76.4% | $86,080 |
| 22 | Madison County, AL | +11.7% | 22.8 | 265 | 68.3% | $86,499 |
| 23 | Henry County, GA | +10.1% | 18.2 | 249 | 74.9% | $83,146 |
| 24 | Guadalupe County, TX | +16.4% | 24.3 | 181 | 77.8% | $92,375 |
| 25 | Coweta County, GA | +9.6% | 12.7 | 231 | 78.4% | $95,548 |
For comparison, the U.S. as a whole grew 3.1% since 2020, permitted 10 new homes per 1,000 in 2025 and has 162 owner-occupied homes per trade contractor. Each county name links to its free market brief.
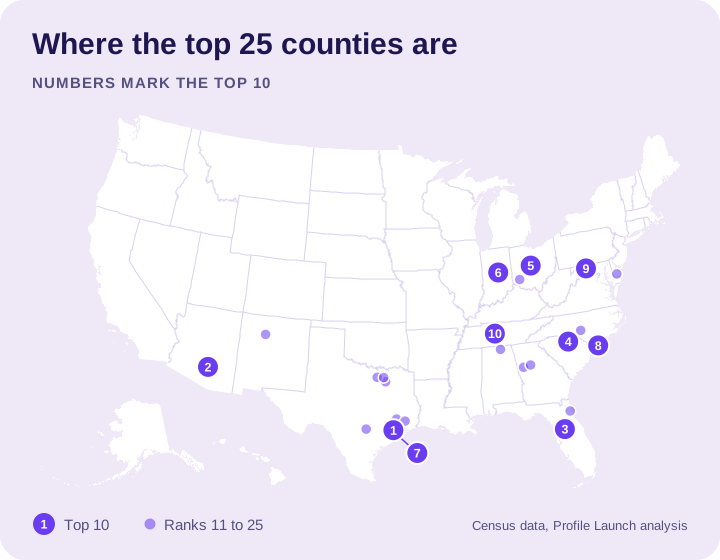
A closer look at the top 10
1. Fort Bend County, Texas
Houston’s southwest suburbs, including Sugar Land, Missouri City and Fulshear. Nearly a million people live here, up 18.3% since 2020. Permits were issued for 12,487 new homes in 2025, 40.9 for every 1,000 existing homes, about four times the U.S. rate. There are 346 owner-occupied homes for every trade contractor, and the median household earns $114,041.
2. Pinal County, Arizona
Between Phoenix and Tucson, home to Maricopa, Casa Grande and Apache Junction. Population is up 26.6% since 2020, and 43.6 new homes were permitted per 1,000 existing ones in 2025. Almost 82% of homes are owner-occupied.
3. Sumter County, Florida
Home to most of The Villages retirement community, plus Wildwood and Bushnell. 87.6% of homes are owner-occupied, the highest share in the top 25, and more than half of residents are 65 or older. It also has the most homes per trade contractor in the top 10: 474.
4. Lancaster County, South Carolina
On the south side of the Charlotte metro. Up 19% since 2020, with 83.3% of homes owner-occupied and 301 homes per trade contractor, nearly twice the U.S. figure.
5. Delaware County, Ohio
North of Columbus, including Powell and the city of Delaware. Up 13% since 2020, with 23.4 new homes per 1,000 in 2025 and a median household income of $133,540.
6. Hamilton County, Indiana
North of Indianapolis: Fishers, Carmel, Noblesville and Westfield. Up 11.4%, with 28.6 new homes per 1,000 and a median household income of $121,530.
7. Brazoria County, Texas
South of Houston, including Pearland, Alvin and Lake Jackson. Up 12.6% since 2020, with 279 homes per trade contractor.
8. Brunswick County, North Carolina
On the coast between Wilmington and Myrtle Beach, including Leland and Oak Island. The fastest-growing county in the top 10, up 27.8% since 2020, with 45 new homes per 1,000 in 2025.
9. Berkeley County, West Virginia
West Virginia’s Eastern Panhandle, around Martinsburg. Up 14.3% since 2020, with 305 homes per trade contractor.
10. Williamson County, Tennessee
South of Nashville: Franklin, Brentwood and Spring Hill. The highest median household income in the top 10, $135,594, with 78.8% of homes owner-occupied.
The best counties by trade
The overall ranking favors growing suburbs. Your trade may want something else.
Roofers: hail and room
Roof work follows storms. These counties have at least one and a half times the U.S. rate of 1-inch or larger hail reports in NOAA’s Storm Events Database, at least 10 roofing contractors, and the most homes per roofer.
| County | 1”+ hail reports per 1,000 sq mi, 2021–2025 | Roofing contractors | Homes per roofer |
|---|---|---|---|
| Loudoun County, VA | 71 | 22 | 5,066 |
| Butler County, PA | 34 | 11 | 5,653 |
| Westmoreland County, PA | 24.1 | 16 | 7,596 |
| Bergen County, NJ | 49.2 | 24 | 9,668 |
| Burlington County, NJ | 28 | 25 | 5,397 |
Storm crews travel. The count shows who is based in the county, not who shows up after a hailstorm.
HVAC, plumbing and electrical
Scored on homes per HVAC, plumbing or electrical contractor, growth, new homes and homeowners.
| County | Homes per HVAC, plumbing or electrical contractor | Growth since 2020 | New homes per 1,000 |
|---|---|---|---|
| Sumter County, FL | 1,339 | +21.6% | 41.8 |
| Lancaster County, SC | 815 | +19% | 25.3 |
| Pinal County, AZ | 662 | +26.6% | 43.6 |
| Fort Bend County, TX | 736 | +18.3% | 40.9 |
| Flagler County, FL | 589 | +21.7% | 42.4 |
Landscapers
New homes need yards, and higher incomes pay for upkeep. Scored on homes per landscaper, new homes, income and homeowners.
| County | Homes per landscaper | New homes per 1,000 | Median income |
|---|---|---|---|
| Fort Bend County, TX | 2,029 | 40.9 | $114,041 |
| Rockwall County, TX | 972 | 36.5 | $127,981 |
| Pinal County, AZ | 1,741 | 43.6 | $80,266 |
| Charles County, MD | 1,249 | 14.7 | $122,816 |
| Sandoval County, NM | 2,160 | 16.7 | $86,636 |
Remodeling and repair
Older homes need repairs. These counties have the oldest housing among counties that are holding or growing population, plus room to compete.
| County | Homes built before 1980 | Homes per trade contractor | Growth since 2020 |
|---|---|---|---|
| Schuylkill County, PA | 78.6% | 296 | +1.4% |
| Monroe County, MI | 58.5% | 305 | +0.8% |
| Muskegon County, MI | 64.2% | 295 | +1.8% |
| Nassau County, NY | 85.4% | 133 | +0.2% |
| Burlington County, NJ | 55.2% | 214 | +4.2% |
The top 10 states
The same five measures, state by state.
| Rank | State | Growth since 2020 | New homes per 1,000 | Homes per trade contractor | Homeowners |
|---|---|---|---|---|---|
| 1 | Delaware | +7.1% | 13.9 | 179 | 73% |
| 2 | South Carolina | +8.8% | 18.8 | 191 | 71.9% |
| 3 | Arizona | +6.5% | 16.1 | 183 | 67.4% |
| 4 | Texas | +8.8% | 17.3 | 194 | 62.6% |
| 5 | Tennessee | +5.8% | 13.8 | 229 | 66.9% |
| 6 | Utah | +8.2% | 21.9 | 89 | 70.2% |
| 7 | Idaho | +10.4% | 22.6 | 78 | 72.1% |
| 8 | Georgia | +5.5% | 13.5 | 190 | 65.7% |
| 9 | Florida | +8.9% | 17.4 | 128 | 67.6% |
| 10 | Alabama | +3.3% | 8.2 | 239 | 70.2% |
Idaho and Utah grew fast but have some of the fewest homes per trade contractor in the country, so a new business there walks into a crowded field.
What the numbers can’t tell you
- The crew next door. Business counts show where companies are based. A contractor one county over can still bid every job in yours.
- Licensing and insurance. Rules change at the state line, and sometimes at the county line.
- Your costs. Rent, wages and insurance can eat the advantage of a fast-growing county.
- Your name. A county where people already know you can beat a better-scoring one where nobody does.
Check your own county
Our Markets map has a free brief for every state, and for every county with 100,000+ people plus the three largest in each state. Each one shows growth, home ages, new homes, hail and competition by trade. Look yours up before you sign a lease or hire a crew.
The bottom line
The best markets have more homes than contractors and more people moving in every year. The top 25 have both. New residents search Google for every service from scratch, so wherever you start, get your Google Business Profile and local SEO in order early.
Starting in one of these counties, or thinking about it? Let’s talk.
Want a hand with your profile?
Tell us about your business and the towns you serve. We can help you decide what to work on next.