Local Wins · Roofing · Denver area, CO
Same Denver Roofer, 2x the Ad Clicks, 44% Less per Click
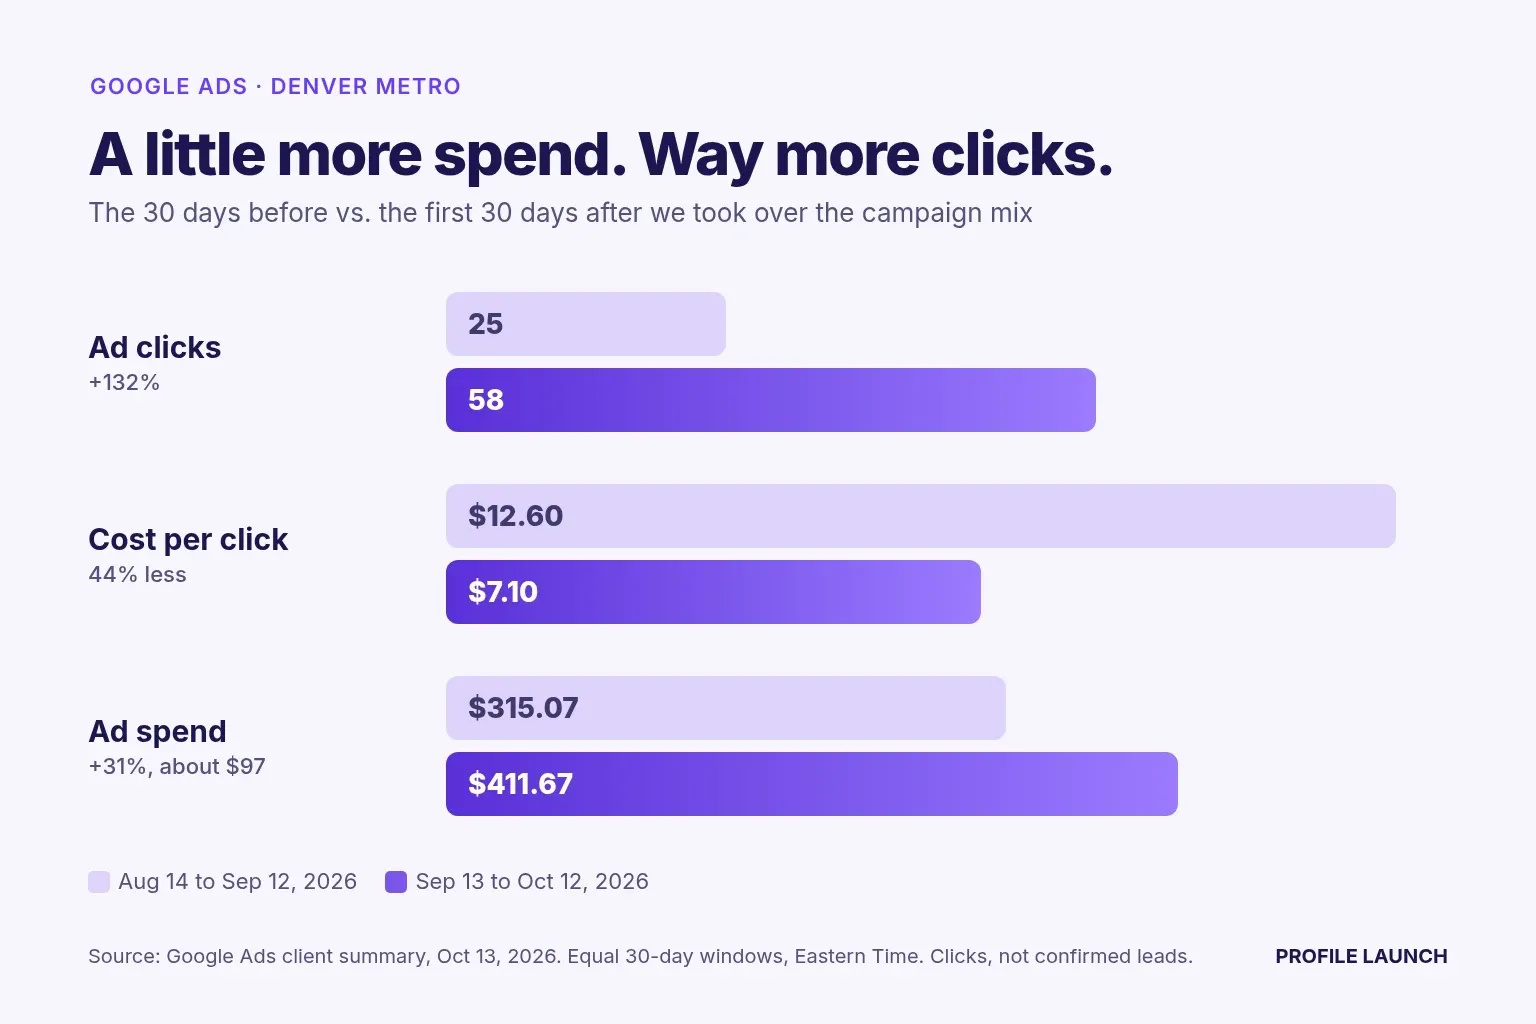
Same roofer, same market, about $97 more in ad spend. Clicks went from 25 to 58 and the average click got 44% cheaper.
Key results
Cost per click, first 30 days44% less
- Google Ads clicks
- 25 → 58
- Average cost per click
- $12.60 → $7.10
- Ad spend, same 30 days
- $315 → $412
A little more money, a lot more clicks
A Denver-area roofer spent $315.07 on Google search ads in the 30 days before we took over the campaign mix. In the first 30 days after (Sep 13 to Oct 12, 2026), they spent $411.67.
So yes, spend went up. About $97. Here’s what the $97 bought:
- Clicks went from 25 to 58. Up 132%.
- The average click went from $12.60 to $7.10. Down 44%.
More than twice the clicks for a little more money. If you run a roofing company, that’s the trade you want.
The problem: paying a lot, hearing a little
This is an established roofer in the Denver area. The company already had a strong reputation. Nobody was confused about that.
The ad side was a different story. In late August, the owner told us by email that Google’s Local Services Ads were running about $2,000 a week and bringing in 1 to 2 leads a month. On the search ads, every click was costing $12.60.
When the phone slows down, every ad platform gives the same advice: raise the budget. We wanted to know where the money was going first.
What we changed
- Pointed the ads at Denver Metro roofing searches. The campaign mix shifted toward people actually looking for a roofer around Denver: roof replacement, new roof installation, roofing contractor.
- No big budget jump. Spend rose about $97 over 30 days. The extra clicks came from where the money went.
- Kept the map working too. They were already the top roofer on the map in their part of the Denver area, so ads didn’t have to carry everything.
- A site worth clicking to. We rebuilt their website, with the call button and the free inspection form right at the top.
How we know
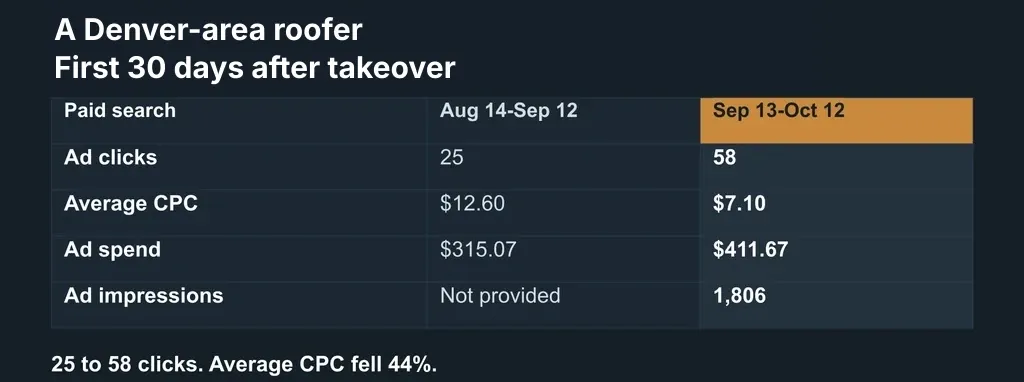
That’s the Google Ads summary prepared Oct 13, 2026. Two equal 30-day windows, Eastern Time.
Google’s own emails point the same way. For the week of Oct 10 to 16, their Denver Metro roofing campaign got 22 clicks at $5.29 each, $116.30 for the week. Google’s October summary put the account’s average click at $6.27, down 29% from September.
The owner, by email on Oct 20:
“Nice on the google ads!”
The map side
On Aug 21 we searched “roofer” from 49 spots across a 5-mile radius in the Denver area. This roofer showed up at 39 of them and held Google’s top 3 across 42.86% of the map. That’s the most of any of the 122 roofers in the scan, including one with a perfect 5.0 and 220 reviews.
Why it matters
Clicks aren’t leads. We’ll say it before anyone else does. But a click is the only way a search turns into a call, and $7.10 a shot beats $12.60 a shot every day of the week.
Most owners hear “more leads” and think “more money.” Sometimes it’s the other way around. Fix where the money goes, then decide if you need more of it.
What it means for roofers in Denver
See the market on our Colorado market brief. The work behind this is our paid advertising, local SEO for roofers and Google Business Profile management. Wondering what a lead should cost you? Start with our lead cost guide.
Where the ad numbers come from
Before and after: the Google Ads client summary prepared Oct 13, 2026, comparing Aug 14 to Sep 12 with Sep 13 to Oct 12, 2026, Eastern Time. Weekly and monthly figures: Google Ads’ own performance emails for the account (week of Oct 10 to 16, and October 2026). Local Services Ads figures: the owner, by email, Aug 28, 2026. Clicks are ad clicks, not confirmed leads.
How we measured
Local rank grid scan with Local Falcon for the search “roofer”: a 7 × 7 grid with a 5 miles radius, 49 points in the service area, scanned on . Each point is where a searcher might be standing; the rank is where the business's Google listing appears on the map there.
Want results like this in your town?
Tell us about your business and the area you serve. We'll show you where you rank today and what we'd work on first.